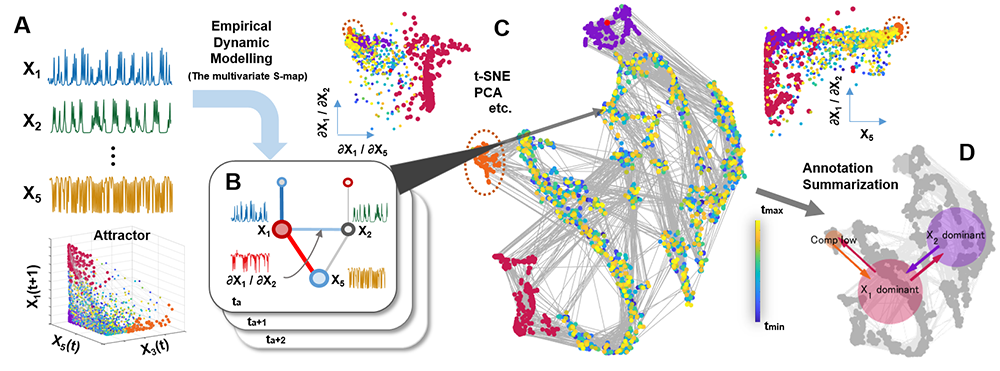
Understanding and predicting the dynamics of ecosystems is a major research issue in promoting ecosystem conservation and sustainable use as stated in the Sustainable Development Goals (SDGs). Recently, Empirical Dynamic Modeling (EDM), a data-driven analysis of measured time series, has been attracting attention (Sugihara et al. 2012). The EDM calculates the temporal changes in relationships among species based on geometric features obtained by embedding measured time series data into the state space (Fig. 1A) (Fig. 1B). However, since the calculated ecosystem dynamics is high-dimensional data and changes over time, it is difficult to grasp its characteristics in detail and gain a mechanistic understanding.
Therefore, in collaboration with a group at UC San Diego, which developed EDM, we are developing a visual analysis system that integrates EDM analysis, dimensionality reduction, and collaborative visualization to help understand ecosystem dynamics (Fig. 1). The visual analysis system can identify the states of ecosystem dynamics, annotate them based on their features, and visualize the transition between states. When this system was applied to ocean mesocosm data, it was able to find new features of the ecosystem and successfully depict the state changes that approach the mechanism. In this way, the combination of advanced analysis methods and information visualization techniques enables better data understanding.

Fig. 1 Visual analytics of ecosystem dynamics (A) By applying EDM to population dynamics time series data, (B) dynamic graphs representing interspecies relationships in ecosystems are constructed. (C) Identify the state of the ecosystem from the constructed dynamic graph using the dimensionality reduction method and linked visualization, and (D) summarize the state transition patterns.


