RESEARCH

Visual Analytics of Dynamics in Natural Sciences Based on Empirical Dynamic Modeling

Understanding and predicting the dynamics of ecosystems is a major research issue in promoting ecosystem conservation and sustainable use as stated in the Sustainable Development Goals (SDGs). Recently, Empirical Dynamic Modeling (EDM), a data-driven analysis of measured time series, has been attracting attention (Sugihara et al. 2012). The EDM calculates the temporal changes in relationships among species based on geometric features obtained by embedding measured time series data into the state space (Fig. 1A) (Fig. 1B). However, since the calculated ecosystem dynamics is high-dimensional data and changes over time, it is difficult to grasp its characteristics in detail and gain a mechanistic understanding.

Therefore, in collaboration with a group at UC San Diego, which developed EDM, we are developing a visual analysis system that integrates EDM analysis, dimensionality reduction, and collaborative visualization to help understand ecosystem dynamics (Fig. 1). The visual analysis system can identify the states of ecosystem dynamics, annotate them based on their features, and visualize the transition between states. When this system was applied to ocean mesocosm data, it was able to find new features of the ecosystem and successfully depict the state changes that approach the mechanism. In this way, the combination of advanced analysis methods and information visualization techniques enables better data understanding.

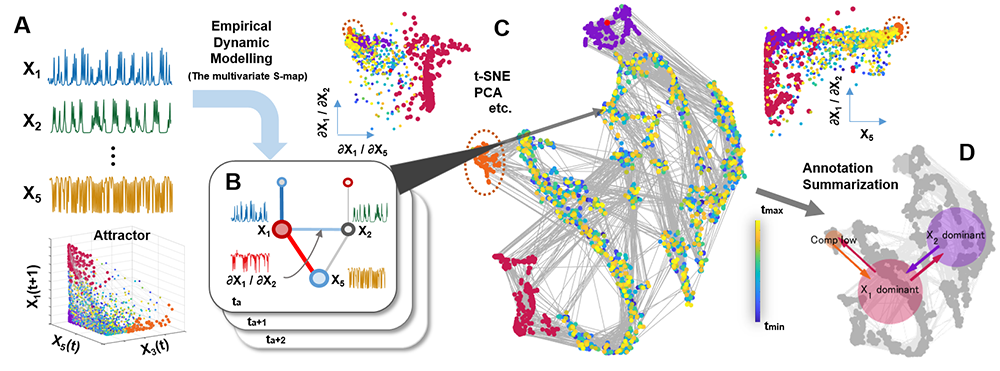
Fig. 1 Visual analytics of ecosystem dynamics (A) By applying EDM to population dynamics time series data, (B) dynamic graphs representing interspecies relationships in ecosystems are constructed. (C) Identify the state of the ecosystem from the constructed dynamic graph using the dimensionality reduction method and linked visualization, and (D) summarize the state transition patterns.

Visual Analytics of Big Data to Facilitate Data-Driven Science

We are studying approaches to visualize and facilitate data interpretation of various kinds of big and heterogeneous data, ranging from life sciences to humanities.

In biology, it is expected that understanding the different layers of information, such as genes, proteins, and phenotypic features, will lead to a better understanding of living organisms. A system that can visualize complex genes and phenotypic features in an easy-to-understand manner and enable cross-hierarchical exploration will help researchers to express their thoughts and facilitate the research process.

Therefore, in collaboration with a team from RIKEN, which has a large-scale phenotypic feature database for C. elegans, we are developing a visual analytics system called “PheGeNet” to support cross-sectional exploration of phenotypic-gene networks. As shown in Figure 2, the gene network (left) and the phenotypic feature network (right) are visualized simultaneously. By linking the two networks based on phenotypic feature relationships that change due to gene knockdown (RNAi), it is possible to investigate which genes work for which phenotypes and which phenotypes are related to which genes. In addition, the system can refer to biological databases and academic papers. We are constructing a workspace on the Web that will allow us to conduct various thought experiments in a data-driven manner.

Fig. 2 Screenshot of PheGeNet, a visual analytics system that supports exploration of phenotypic-gene networks.


In humanities, the formation of many ancient texts remains a mystery. By developing a system of “visual analytics,” in which various features are visualized interactively, it becomes possible to present an overview of the chronological and geographical features in the ancient Vedic corpus, something that individual analysis fails to achieve. We aim to integrate Indian studies with visual analytics that is the science of analytical reasoning facilitated by interactive visual interfaces. While this spatiotemporal literature mapping will be, itself, one result of this research, it will also serve as a departure point for deeper discussions into the development of ancient Indian society.

Fig. 3 Co-occurrence relation search system for mantras in ancient Indian literature.

Visualization and Visual Cognition

Seeing data does not mean seeing things as they are. The light from the monitor is converted into electrical signals in the retina, and then travels through the optic nerve to the visual cortex via the lateral geniculate nucleus, where it is processed for visual information, allowing us to see what it is.

Seeing data does not mean seeing things as they are. The light from the monitor is converted into electrical signals in the retina, and then travels through the optic nerve to the visual cortex via the lateral geniculate nucleus, where it is processed for visual information, allowing us to see what it is.

While many studies on visual cognition and neuroscience have revealed some aspects of human visual characteristics, the effects of visual complexity on cognitive load in information visualization, such as graph drawing and interactive visualization have not yet been elucidated.

Therefore, we evaluate the effect of the layout method of group-in-a-box layout, which is a graph drawing layout with a group structure, on human information search using eye movement measurement and biometric measurement, and study the better visualization design for human.

We are working on the evaluation and redesign of visualization methods using biometric measurements, and researching how humans and computing can be connected through seeing.

Fig. 4 User experiment of node link diagram and analysis of eye tracking information.

TOP